Dashboard
Your home base: daily focus, your streaks, and the fastest route into every section.

The ultimate traders resource hub
Plan your trades, protect your capital, track your edge, and train your mindset — all in one place.
Your home base: daily focus, your streaks, and the fastest route into every section.
See what's actually working: win rate, equity, setups, and mistakes, all from your journal.
Log trades with entry, exit, emotions, and lessons — your stats calculate themselves.
Check the calendar and headlines before you trade, and know what to avoid.
Turn a monthly target into daily process goals, limits, and a review plan.
Turn your setups into repeatable rules, from beginner foundations to Smart Money Concepts and Wyckoff.
Start wherever you are: the free Starter Kit, TradingView, sessions, Smart Money, Wyckoff, and mindset.
Protect your capital first: size every trade right and set loss limits before you place it.
Trading is 5% skill and 95% mental: audios, tools, workbook, and daily reminders to keep your head right.
The ultimate traders resource hub
Key results and the P&L calendar show how execution is translating into returns.
The equity curve and key win-rate metrics reveal the shape and consistency of your edge.
Cumulative net P&L, starting at zero
Across closed trades
Sample results shown for demonstration. These are simulated figures from sample trades — not real trading results. Past performance does not guarantee future results. Trading involves substantial risk of loss.
Daily results in context
Size a trade quickly, or expand the advanced calculator for exact entry, stop, target, and broker specifications.
A compact pre-trade risk check
Exact pricing, allowed size increments, and target planning
Starter specifications are provided for planning. Confirm them with your broker.
Educational calculator only. Point values and contract sizes vary by broker and account. Verify every specification and the final order size before placing a trade.
The latest journal entries, with each plan and net result easy to scan.
Keep psychology visible alongside performance, planning, and risk.
Explore 20 full audio recordings across two voices, the paired fillable workbook and cheat sheet, six companion mindset tools, and the Rich Rising morning routine.
Move from insight to a repeatable plan with goals, market context, and setup rules.
Turn your monthly target into weekly process goals, daily limits, and a clear review plan.
Review the economic calendar and record the market context that matters before the session.
Keep proven setups and entry criteria close so every trade begins with a defined process.
This Dashboard is just one of nine main sections of Traders Toolbox — the same nine tabs in the strip at the top of this page. Each card below opens a full section of the site.
Equity curve, calendar, and breakdowns that show the shape of your edge.
Log every trade with its price plan, mindset notes, and lessons.
Economic calendar, key-release decoder, and daily news research tools.
Monthly targets broken down into weekly process goals and daily limits.
Proven setups and entry criteria, ready before every session.
Structured courses and guides — Smart Money Concepts, Wyckoff, and more.
Position-size and pip calculators, guardrails, and pre-trade plans.
Broker-specific sizing, prop firm cost analysis, and pro risk workflows.
The Mindset Zone — audios, workbook, and tools for calm, disciplined trading.
Log every trade with entry, exit, emotions, mistakes, and lessons. But this isn't just a diary — it's a performance analytics engine. It calculates your win rate, profit factor, expectancy, and R-multiples automatically. It shows you which setups work, which sessions are profitable, and which mistakes are costing you the most.
Where your closed trades land, measured in R — net P&L divided by planned risk.
A healthy journal clusters winners at +1R and beyond, with losers contained near −1R. A heavy left tail usually means stops are being moved or risk is drifting up.
The same trades, sliced five ways.
A heatmap of your trading results by time of day.
It shows your profit and loss by hour of the day, so you can see which sessions actually make you money and which ones cost you.
Add your trades, then read the heatmap — trade more in your green hours and stand aside in your red hours.
You get a clear, repeatable process instead of relying on memory or emotion.
When do you actually make money?
Educational content only, not financial advice.
Use these in order around your trading day: prepare before the session, record execution trade by trade, reset after a loss, then score the week. The checklist and Cost of Impatience calculator below support the same journal workflow.
Define your edge, log twenty mechanical trades, and score rule adherence beside the records in your Trade journal.
LockedA deeper spreadsheet companion for logging trades, reviewing performance, and keeping your journal offline.
Coming SoonPause before entry and confirm that the setup follows your risk rules and written plan.
Complete each check for the trade you are considering. Your selections last only for this visit.
0 of 6 complete
Be honest: how many trades per month do you take from boredom, FOMO, revenge, or just feeling like you “should” be in the market? Enter that number and your average loss on those trades. The yearly total will sting — and that's the point.
That's the price of impatience.
This reflects only the values you enter. It is an estimate of cost, not a projection or promise of future results.
6 rapid-fire checks — YES or NO, no maybes.
Most account damage happens when state is off, not when analysis is wrong.
Answer the 6 checks honestly before every session — if any answer is NO, do not trade until it is fixed.
You get a clear, repeatable process instead of relying on memory or emotion.
Your 30-second GO / NO-GO ritual — a non-negotiable pause before every trade.
6 rapid-fire checks — YES or NO, no maybes.
Most account damage happens when state is off, not when analysis is wrong. This ritual catches the trade that should never have been placed.
Immediately before every trade. Under 30 seconds. No exceptions.
Educational content only, not financial advice.
Educational content only, not financial advice.
A personal pre-commitment plan: your limits, your contract, your near-target danger-zone protocol.
Evaluations are usually lost to behavior near the finish line — sizing up, boredom trades, one tilted afternoon — not to strategy.
Fill this out before starting any evaluation.
You get a clear, repeatable process instead of relying on memory or emotion.
Decide your rules before the pressure arrives.
Enter your prop firm's numbers. Your personal limits (Step 2) must sit inside these — never at them.
The firm's maximum permitted loss on the account.
All times in Eastern Time. Trading outside this window is a broken rule.
Tap to set your personal limits — written now, in a calm state, so the stressed version of you decides nothing.
Set this below your firm's daily loss limit. When you hit YOUR stop, the session ends.
Check a rule only if you agree to follow it even when it hurts.
The last stretch is the highest-risk part of the evaluation — not because the market changes, but because you do. Enter your current profit and watch the zone.
Your locked-in profit on the evaluation account right now.
Honesty here is the whole point. If any are true, the protocol below applies now.
The protocol: within ~20% of target — no new experiments, no new instruments, no size changes. Checklist before every trade: setup – stop – target – size. After a green day: same plan tomorrow. After a red day: same plan tomorrow.
Decide once; do not renegotiate every morning. Print or save this card and keep it where you trade.
No rules checked yet.
Passing changes the account, not the trader. Same size for the first 20 funded trades. Same daily stop, same max trades, same session window. The funded account gets the same red-card protocol.
Educational content only, not financial advice.
A 10-second tilt check with a fixed stop rule.
Tilt is where trading plans fall apart — this card decides while you are calm.
In the moment, mid-session — any time something feels off.
You get a clear, repeatable process instead of relying on memory or emotion.
Answer honestly. If you have to talk yourself into a YES or NO, treat it as YES.
Protects your capital while judgment is compromised — it turns “I know I’m tilted” into a concrete stop rule.
Run the check the moment you feel heat, urgency, or the pull to size up. Follow the verdict — no negotiating with the card in the moment.
Keep it open beside the platform. Use it after any loss and any time a session feels heated.
Every run trains earlier pattern recognition — you start noticing tilt before it costs you.
Same card, same rule, every session — until stopping on tilt becomes automatic.
Educational content only, not financial advice.
Three execution drills: a randomness simulator , a 20-trade series tracker , and a fear-of-being-wrong journal .
Any single trade is random — a valid setup can lose, a sloppy entry can win.
Daily mindset work.
You get a clear, repeatable process instead of relying on memory or emotion.
Turn probability thinking into a practiced skill — not something you read about, something you drill.
Three execution drills: a randomness simulator, a 20-trade series tracker, and a fear-of-being-wrong journal.
Any single trade is random — a valid setup can lose, a sloppy entry can win. Traders who judge themselves trade-by-trade stay stuck in fear, hesitation, and rule-changing. These drills train you to accept the outcome of any one trade and judge the series.
Daily mindset work. Station 1 & 3: pre-session (before your first trade). Station 2: log every trade, review at 20.
Station 1 · The market is a probability machine
Flip 20 times. Watch losing streaks appear by pure chance — no broken setup, no broken trader. That is what randomness looks like, and your series of trades lives inside the same math.
W = win flip · L = loss flip
Wins / 20
–
Losses / 20
–
Longest win streak
–
Longest losing streak
–
Illustration of randomness — not market data, not a prediction of your results.
Say or write this before entering — especially when you feel hesitation:
"I accept that this trade can lose. My risk is defined, the plan is clear, and one outcome does not define my series."
Station 2 · The 20-trade commitment
Commit to your next 20 trades exactly by plan — same risk per trade, same rules. Grade only whether you followed the plan. You are not trying to win 20 trades. You are practicing accepting the outcome of any one trade.
Row 1 is a worked example — edit it or delete it and log your own trades. If a rule needs changing mid-series, write it down and change it only after trade 20.
| # | Setup | Planned risk | Result (R) | Plan followed | Delete row |
|---|
Trades logged
0
Win rate
–
Total R
–
Expectancy (R/trade)
–
Expectancy = total R ÷ trades logged. A series can have a win rate under 50% and still show positive expectancy when winners are larger than losers.
A losing trade taken strictly by plan is good process with a bad outcome. A winning trade taken impulsively is bad process rescued by luck. At trade 20, the only score that matters is the plan-followed percentage — not the P&L.
Station 3 · Fear-of-being-wrong journal
Hesitation on valid setups usually traces to fear of being wrong, not to a bad setup. Ten minutes, after the session — or right before one, when hesitation is live. Answer honestly, then tap each reframe.
1. What am I afraid of?
Reframe
Fear is data, not a stop sign. It is pointing at the exact belief to examine: that one loss says something about you. It doesn't — it says something about probability, and probability needs no apology.
2. What is the actual risk, in dollars?
Reframe
The mind inflates undefined risk into catastrophe. A defined dollar number shrinks fear back to its real size — a known, accepted cost of doing the business of trading, decided before the trade, not during it.
3. What would I do if I weren't afraid?
Reframe
The unafraid version of you already knows the answer — it just wrote it. The job was never to eliminate fear; it is to let the plan act while the fear watches. Execute the plan's version, and let the outcome belong to the series.
End every journal entry with one process goal for tomorrow — never a P&L goal. Example: "I will read the acceptance script before my first entry."
Educational content only, not financial advice.
Educational content only, not financial advice.
a 5-question execution check.
It grades how well you executed your plan on each trade, so you can see whether your losses come from the plan or from breaking it.
grade immediately after closing each trade, while the memory is fresh — before the next setup forms.
You get a clear, repeatable process instead of relying on memory or emotion.
Mindset Zone · Tools
Grade every trade in under 30 seconds. Answer 5 yes/no questions and get an automatic A, B, or C — plus a running tally of your execution quality.
All times shown in ET. Nothing is saved — everything lives in this session only.
What it is: a 5-question execution check. Five yes/no answers produce an automatic A, B, or C grade for the trade.
Why use it: P&L doesn't measure discipline — a lucky off-plan win looks identical to a planned one. The grade separates process from outcome.
Benefit: one letter per trade, one line of coaching, and a running distribution that shows your true execution quality at a glance.
How & when: grade immediately after closing each trade, while the memory is fresh — before the next setup forms.
Where it fits: your post-trade routine, inside the Mindset Zone toolkit. Thirty seconds, every trade, no exceptions.
Beyond the grade: the tally bar tracks discipline over time — the A-share trend is your real progress metric, not the balance curve.
Keep using it: honest C grades are the most valuable data you'll collect. A week of honest grading beats a month of selective memory.
Grading rule: 5 yes = A · 3–4 yes = B · 0–2 yes = C.
Answer honestly — the grade measures your process, not your P&L.
Answer all 5 questions to unlock the grade.
Trade #1 · — ET
—
—
No trades graded yet this session.
Educational content only, not financial advice. Times shown in ET. Grades reflect self-reported answers; nothing is saved or sent anywhere.
Educational content only, not financial advice.
An interactive 30-trade test: does this setup really work? tool for your trading routine.
It guides you step by step so nothing gets missed.
Open it when you need it and follow the steps.
You get a clear, repeatable process instead of relying on memory or emotion.
One playbook. Thirty trades. A real sample size — no verdicts before the work is done.
Educational content only, not financial advice.
Verdicts are practitioner guidance based on your logged R-multiples — not statistical proof and not a recommendation to trade.
Educational content only, not financial advice.
Five minutes before the session. Seven checks — if one is empty, you are not cleared to trade yet.
Not cleared yet — complete all 7 checks before your first trade.
Feeling rushed? Hesitant? Euphoric? Tilted? Click what you're feeling right now and get a specific reset protocol for that exact emotional state. This isn't generic “take a deep breath” advice — it's targeted interventions for the 5 emotional states that destroy trading accounts.
Feels like: Steady breathing, no rush, thoughts are clear.
Follows the plan as written and accepts whatever the market does next.
PATIENCE PAYS. Educational content only, not financial advice.
A structured weekly review that walks you through your trades and turns what you find into a rule change — only when the evidence supports it.
It guides you step by step so nothing gets missed.
Once a week, work through the review steps and log what each mistake cost you; change a rule only when the evidence says so.
You get a clear, repeatable process instead of relying on memory or emotion.
Daily, weekly, and monthly reviews that turn logged trades into better behavior — without storing anything. This tool is stateless: everything you enter lives only in this page session.
Do this right after the session ends. Speed matters more than depth: you are catching behavior drift while the day is still fresh.
Best = best process, not biggest winner.
Worst = worst process. A rule-break winner still counts as a rule-break.
Grade the trade day on process, not P&L. A = perfect plan adherence · B = minor deviation · C = broke a rule.
Group the week's trades by setup. Expectancy is scored per trade, in R — keep setups with positive expectancy and question the rest (verdicts need 30+ logged trades, not one week).
Expectancy (R/trade) = Net R ÷ Trades
This is the same value as the textbook form (win rate × avg win) − (loss rate × avg loss), because Net R already equals (wins × avg win) − (losses × avg loss).
Worked example: a setup with 10 trades, 6 wins, net +8.5R.
Win rate = 6 ÷ 10 = 60%. Expectancy = 8.5 ÷ 10 = +0.85R per trade.
Check against the textbook form: if the average win was 2.0R and the average loss was 0.875R, then (0.60 × 2.0) − (0.40 × 0.875) = 1.20 − 0.35 = 0.85R. Same answer.
Tap every mistake tag that showed up this week, then enter the R it cost. A multi-tag trade counts toward each tag. Fix one leak at a time, starting at the top of the ranking.
Single and specific — the fix for your top-ranked leak above.
Process before P&L — a green week with rule-breaks is still a C.
Complete the weekly mistake ranking above — the tag with the worst net R appears here automatically.
Rule changes are only allowed here, and only on real evidence — never on a single week's noise.
Answer from your journal data, not from memory.
One change only. Name the evidence — sample size and expectancy — not the feeling.
Educational content only, not financial advice.
A log that sorts every mistake into a category, so you can see which error is costing you the most.
It turns a list of mistakes into a ranked picture of your most expensive habits, so you fix the biggest leak first.
Log right after the mistake while the decision is fresh — memory rewrites the past.
You get a clear, repeatable process instead of relying on memory or emotion.
An interactive cost-of-mistakes analyzer for your trading journal.
| Tag | Times | Total R | Avg R |
|---|
Educational content only, not financial advice.
Tag at log time. Fix one leak at a time. No shame — only data.
Educational content only, not financial advice.
a weekly mistake ledger.
& how ▾ What it is: a weekly mistake ledger.
log leaks the same day they happen (60 seconds each).
You get a clear, repeatable process instead of relying on memory or emotion.
Journal · Analytics
Log each trading mistake through the week, then get an automatic summary of your biggest leak — the one habit costing you the most R — with ranked fixes and one commitment for next week.
All times shown in ET. Nothing is saved — everything lives in this session only.
What it is: a weekly mistake ledger. Each leak you log is tagged with one of the 8 standard mistake tags and priced in R lost.
Why use it: traders repeat the same 1–2 leaks for months because no single summary names them. This names yours automatically.
Benefit: instead of a vague "I need to trade better," you get one named leak, its R cost, and ranked fixes.
How & when: log leaks the same day they happen (60 seconds each). Run the digest every Sunday evening before planning next week.
Where it fits: the Sunday analytics routine — journal review first, digest second, then your weekly plan.
Beyond the math: the digest doesn't just add up R. It converts the cost into a ranked fix list and one concrete commitment, so the week actually changes something.
Keep using it: week-over-week comparison only becomes meaningful after 3–4 weeks. The leak that stops repeating is the one you keep measuring.
Week dates load here.
Pick a day, a tag, and the R lost, then add it.
Your biggest leak this week
—
—
Write the single change you'll make — then check the box to lock it in.
Educational content only, not financial advice. Times shown in ET. All entries are sample or session-only data; nothing leaves this page.
Educational content only, not financial advice.
A step-by-step replay of a trade's chart, bar by bar, so you can practise reading price action as it unfolded.
It guides you step by step so nothing gets missed.
Open it when you need it and follow the steps.
You get a clear, repeatable process instead of relying on memory or emotion.
A structured manual-replay review. No replay engine needed — walk a chart bar by bar and review your decisions.
Log what you see on each bar. Tap Long / Short / Wait for the action you would take.
Educational content only, not financial advice.
Times shown in ET.
Educational content only, not financial advice.
An interactive my progress: where am i in my journey? tool for your trading routine.
It shows where you are in your trading journey — what you have completed, what is next, and how far you have come.
Open it when you need it and follow the steps.
You get a clear, repeatable process instead of relying on memory or emotion.
Continue where you left off. Tap a status pill to move a row forward — your progress updates live.
Educational content only, not financial advice.
Prototype — saving progress across visits arrives with site accounts later. Times shown in ET.
Educational content only, not financial advice.
Review the same session research beside your trade notes, or open the full monthly news workspace.
Your journal shows what happened. Trading Goals turns it into the daily, weekly, and monthly targets you trade against next.
Turn your journal into clear performance insight with P&L, equity, win rate, setup breakdowns, mistake tracking, trade replay, consistency, prop-firm progress, and a guided weekly review.
Win rate, profitability, equity growth, and recent trade results at a glance.
Cumulative net P&L, starting at zero
Across closed trades
Your latest five entries
Momentum without losing sight of process
Frequency across your journal
Based on five confluence checks recorded at entry
Reveal the saved chart in steps so future candles stay hidden
Step 0 of 12
Start with exact FTMO defaults, then adjust any field for your broker or account.
All figures, targets, and limits shown here follow FTMO's published Trading Objectives for standard and swing accounts (2-Step and 1-Step programs). FTMO may update its rules at any time — always verify the current objectives on FTMO's official page before trading. This tool is an independent planning aid and is not affiliated with or endorsed by FTMO. View official FTMO Trading Objectives ↗Start Your FTMO ChallengeWe may earn a commission if you start an FTMO Challenge through this link — at no extra cost to you.
Guided demo analysis using your recorded fields
This static demo uses transparent rules in your browser. Connected AI coaching belongs in the account-based version.
Numbers, process, and one improvement for next week
Three review rhythms, one habit. The metrics pre-fill from your journal; you add the honesty.
Check the live economic calendar and headlines, learn how major releases affect key markets, set no-trade windows, keep daily and weekly research notes, and use the interactive planning tools.
Review current event times, currencies, impact levels, actuals, forecasts, and previous readings below. Return here to record the research that matters to your plan.
Not all news is equal. This decoder breaks down the major economic releases — what they measure, why they move markets, and specifically how they tend to impact US30, gold, and NAS100. No economics degree required.
Core lesson: markets usually react to the surprise — the gap between the actual reading and the forecast, plus any revisions or guidance — not to the headline number in isolation.
Around high-impact releases: spreads can widen, stop-order slippage can increase, and quotes can pause. Define a no-trade window in your written plan. Calendar times may follow your device or widget settings; Toolbox session materials use ET, so convert before comparing.
Educational context only — these are common market relationships, not predictions, trade calls, or financial advice.
Economic releases don't land in a vacuum — they land in a session. The same high-impact event can behave very differently depending on how much buying and selling is happening at the time. Traders call this liquidity. All session windows below are described in Eastern Time (ET) year-round; local clock conversions can shift with daylight-saving changes.
Put it into practice: That's why the Toolbox session materials mark killzones in ET: they outline the windows where liquidity — and therefore news impact — concentrates. Check the calendar above, note which session your red events fall in, and set your no-trade windows around the overlap.
Swipe or use the controls to review what each release measures, its typical ET schedule, the markets it tends to move most, and a simple before-during-after routine.
TradingView news for index context or gold-related futures. Headlines are for research, not trade direction.
Map the week's red events before the market opens. These entries stay only while this page is open; export a text copy when you are finished.
Every Sunday evening or Monday pre-market, spend 10 minutes mapping the week's red events. Note which ones affect your instruments, decide in advance whether you'll trade through them or stand aside, and set price alerts for the key levels. This short planning habit can help you prepare for scheduled news events and reduce avoidable surprises. Export your gameplan and keep it next to your trading station all week.
Open the live calendar, copy this week's red events, set your windows, then return after the week for the review.
Keep the ET timing guide close, work through major releases, plan the week, log price reactions, and debrief what happened after the print — every tool runs interactively, right here in this News section.
Track each release as it lands: the event, forecast versus actual, surprise direction, first reaction, follow-through, and your execution notes. Your log lives in this tab for the session — download a copy when you're done.
A 14-point go / no-go checklist that runs before every red-folder release so you enter prepared — or stand aside.
News releases create the fastest, most deceptive price action of the trading week.
Before every red-folder release — CPI, NFP, FOMC and other high-impact events — every single time, no exceptions.
You get a clear, repeatable process instead of relying on memory or emotion.
Interactive pre-release go / no-go
Preparation decides the outcome before the number ever prints.
The fake-out window. Patience here is the edge.
The trade is data. Log it, or the lesson is lost.
Check every item to clear yourself for this release. Unchecked items are your gaps:
The first move is often the fake-out. The second move is the trade.
Missing a release is free. Trading one unprepared is tuition.
Educational content only, not financial advice.
A step-by-step decoder that walks you through the six reasons price moves against the headline.
It walks you through the six reasons price can move against the headline, so you stop blaming the news and start reading the reaction.
Pick the headline, then answer each step in order — the decoder reveals the next step only after you answer, and gives you a verdict at the end.
You get a clear, repeatable process instead of relying on memory or emotion.
Why did it move “wrong”? Decode the release in 3 steps.
A step-by-step decoder that walks you through the six reasons price moves against the headline.
The market trades expectations, not headlines. This shows you what it actually reacted to.
Right after a confusing release — before you trade it, journal it, or wonder about it.
Answer two questions about the release you just watched.
1. What did the headline result look like?
2. What did price do right after?
Educational content only, not financial advice.
Release times shown in ET.
Educational content only, not financial advice.
Turn setups into repeatable rules with structured builders and starter examples — from beginner foundations through TradingView, Smart Money Concepts, and Wyckoff.
Turn observations into repeatable rules. Use the starter examples as references, then document your own market context, entry sequence, invalidation, targets, and post-trade conclusions.
Keep, adapt, or replace these structures in your own testing process.
Join established directional flow after a controlled pullback into structure.
Trade acceptance beyond a meaningful level, not the first impulsive break.
Look for a failed push beyond an obvious swing before price reclaims range.
Capture the complete decision process—not just the entry trigger.
No custom plays added yet.
Begin with the Ultimate Traders Starter Kit, available free with email. TradingView Mastery and the remaining courses and training modules are coming soon.
Complete course
Course · cheat sheet · fillable worksheet
Master the three laws, Composite Operator, phases A–E, trade planning, and “Name the Phase” practice with an answer key.
Planned companion resources: Wyckoff Playbook Training Module + cheat sheet
Coming soon
Complete course
Study structure, liquidity, order blocks, fair value gaps, premium and discount, and applied entry models.
Planned companion resource: SMC Playbook Training Module
Coming soon
Coming soonInteractive · on this site
Learn the complete charting workflow—from symbols and drawing tools to alerts, paper trading, and broker connections.
New to TradingView? Create your free account hereWe may earn a commission if you subscribe — at no extra cost to you.
PDF file · free with email · interactive edition on this site
Build the fundamentals prerequisite: market language, chart reading, setup, risk, psychology, execution, journaling, and review.
Focused companion modules · Coming soon
An interactive learning module for developing a structured Wyckoff process.
Focused lessons, worksheets, a knowledge check, and a structured playbook builder.
Six liquidity lessons, confluence-spotting drills, worksheets, and a knowledge check — a planned drill companion to Liquidity: The Complete Course.
Educational material only. Nothing in these courses is financial advice, a trade recommendation, or a guarantee of results. Trading involves substantial risk of loss.
Interactive tools for your playbook workflow — check setups, place stops, track performance, and learn from mistakes.
A 7-gate check that decides whether a setup is a sweep play, a breakout play, or no trade.
Most losses come from trading a level break that was actually a sweep — or hesitating on a real breakout.
Answer the 7 gates in order — a single "no" at any gate means no trade; only a clean pass through all 7 is a sweep or breakout play.
You get a clear, repeatable process instead of relying on memory or emotion.
Educational content only, not financial advice.
All session times shown in Eastern Time (ET).
Educational content only, not financial advice.
/ why / when strip ---- */ .
/ when strip ---- */ .
After your analysis, before your state check, before every entry.
You get a clear, repeatable process instead of relying on memory or emotion.
A per-playbook go / no-go checklist. If every box is checked, the setup is valid. If one isn't, you have your answer.
A 7-point entry checklist matched to your exact playbook — no generic trading advice, only the confirmations that playbook needs.
Most bad trades aren't bad analysis — they're skipped steps: no invalidation, no size math, wrong session. This catches the skip before money is at risk.
After your analysis, before your state check, before every entry. It is the bridge between "I see a setup" and "I execute."
Where it fits your routine: run this on every entry, every session (all times ET). It takes under a minute, and it does something willpower can't — it keeps the plan honest when emotions get loud. Use it until checking feels automatic; keep using it after that, because discipline fades faster than habit.
Tap the setup you analyzed. Your checklist is built for that playbook alone.
Run your state check, then execute.Every confirmation is in place — invalidation, size, and session all match the plan.
Educational content only, not financial advice.
Every setup’s exact invalidation price — and exactly where the stop belongs for each one.
A stop at a round number or a fixed distance is fuel for the market.
Before every entry.
You get a clear, repeatable process instead of relying on memory or emotion.
Enter your entry, your invalidation price, and the protected swing. The tool measures the stop distance and checks whether your stop actually sits beyond the protected swing.
Risk 1–2% of the account per trade is the professional standard; developing traders stay at 0.5–1%. Correlated positions stay capped at 3–4% combined.
Educational content only, not financial advice.
An interactive autopsy of the ten mistakes that break playbook setups — what each looks like, why it fails, and the correct read.
it fails, and the correct read.
Weekend study — learn from these mistakes without paying for them in the market.
You get a clear, repeatable process instead of relying on memory or emotion.
Traders Toolbox · Playbooks
The ten ways playbook setups fail — each with the correct read.
How to use: filter by where the mistake happens — Entries, Exits, or Risk. Tap any card to run the full autopsy: the setup, the failure, the correct read, and a wrong-vs-right comparison. Study one a day and log every catch in your trading journal.
Educational content only, not financial advice.
Educational content only, not financial advice.
Educational content only, not financial advice.
An interactive playbook stats: which setup actually works? tool for your trading routine.
It guides you step by step so nothing gets missed.
Open it when you need it and follow the steps.
You get a clear, repeatable process instead of relying on memory or emotion.
Per-setup stats that show which playbooks earn their keep — measured in R, not feelings.
1R = your planned risk on the trade. +1.5R means you made 1.5× your risk; −1R means you lost the full planned risk.
Educational content only, not financial advice.
Expectancy and win-rate figures update live as you log — a practitioner self-review aid, not a performance guarantee.
Educational content only, not financial advice.
PATIENCE PAYS.
Browse the full library — the free Starter Kit, TradingView, sessions and timing, Smart Money Concepts, Wyckoff, mindset training, bundles, and mentorship — and start wherever you are.
A fundamentals-first path through market language, chart reading, broker and platform setup, risk, psychology, execution, journaling, and review.
Outcome: go from zero to placing your first planned, risk-sized trade — with a 7-day and 30-day practice plan.
Who it's for: complete beginners and any trader missing a fundamentals foundation.
What you get: the complete Starter Kit as a PDF file, free after email signup — yours to keep, plus the interactive edition right here on this page.
Work through the five parts in order and fill in each practice as you go. Your answers stay in this tab for the session — download a copy of your completed kit at the end.
A complete guide to the platform—from first login to charting, drawing tools, indicators, alerts, paper trading, broker connections, and a professional daily workflow.
Outcome: run your full daily charting workflow in TradingView — symbols, drawings, indicators, alerts, and paper trading.
Who it's for: traders setting up TradingView for the first time, or using a fraction of what it can do.
Planned format: the complete interactive course on this page · Coming soon.
New to TradingView? Create your free account hereWe may earn a commission if you subscribe — at no extra cost to you.
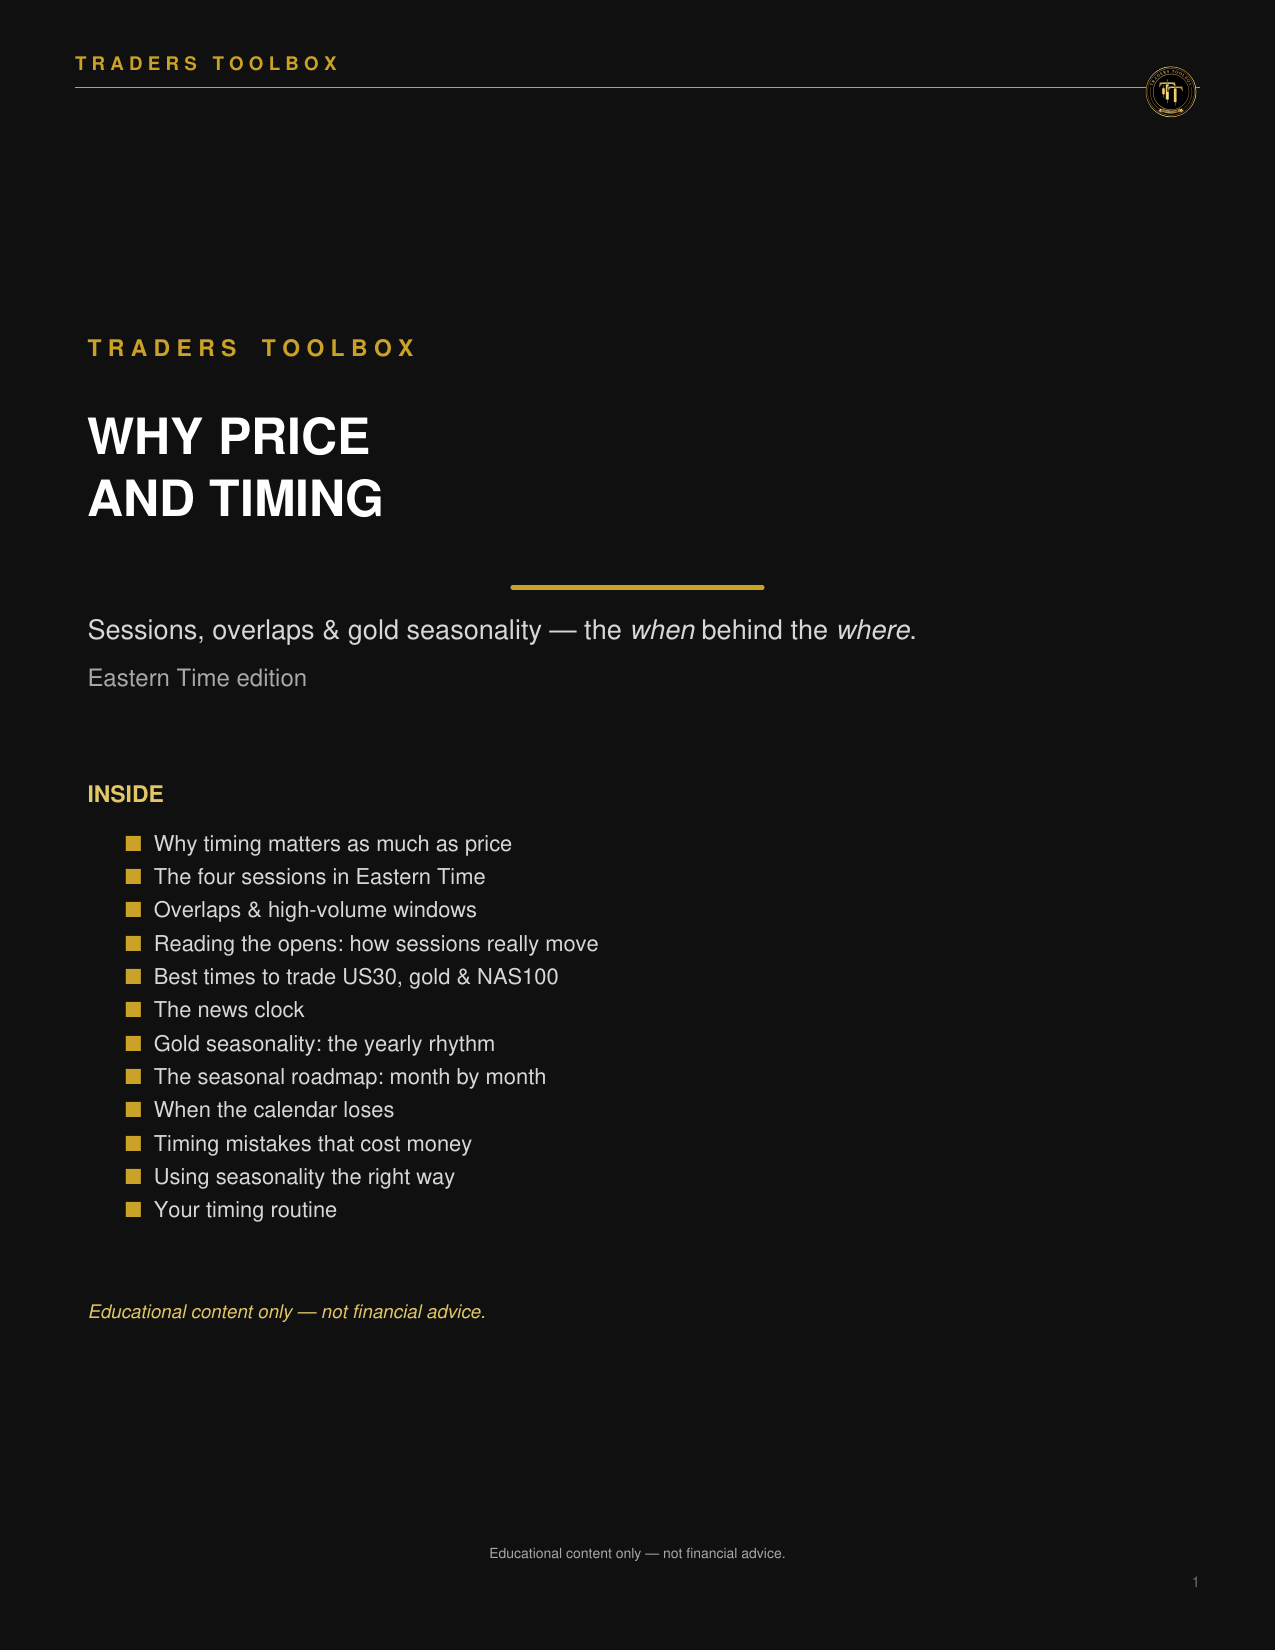
When to be at your charts: the 24-hour sessions map in ET, best trading windows for US30, gold and NAS100, the news clock, and gold seasonality.
Outcome: schedule your trading day around the ET session map and plan around the news clock.
Who it's for: traders who sit at their charts at the wrong hours.
Planned format: an interactive guide on this page · Coming soon.

Structure, liquidity, order blocks, fair value gaps, premium and discount, and entry models—organized into a complete course.
Planned companion resource: SMC Playbook Training Module
Outcome: read market structure, liquidity, and entry models on your own charts.
Who it's for: intermediate traders ready for a full market-reading method.
Planned format: the approved complete SMC course with its companion training module.
The three laws, Composite Operator, market cycle, accumulation and distribution, phases A–E, and structured trade planning.
Planned companion resources: Wyckoff Playbook Training Module + cheat sheet
Outcome: name the phase and plan trades from accumulation and distribution.
Who it's for: traders who want a complete auction-market framework.
Planned format: the approved course, cheat sheet, fillable worksheet, and companion training module.
10 guided tracks in two voices for building a probability-based, consistent trading mind, including the 30-affirmation loop.
Outcome: build a probability-based daily psychology routine with guided audio.
Who it's for: traders who want a structured daily psychology routine alongside their chart work.
What you get: 20 full recordings plus the workbook, cheat sheet, Rich Rising routine, five email-unlocked companion tools, and the free Stage Tracker.
Who it's for: traders who want both market-reading methods in one collection.
Planned collection: both complete courses plus TradingView Mastery, with final contents confirmed after QA.
Who it's for: traders who want the complete library — both courses, TradingView Mastery, and the Mindset Audio Program.
Planned collection: the full four-resource library, with final contents confirmed after QA.
Guided, community-based trader development — built on the same process-first principles as the Toolbox.
Who it's for: traders who have finished the Starter Kit and want live guidance applying it.
Mentorship is educational guidance — not trade signals, not financial advice, and no guaranteed results.
Quick answers about course access, educational scope, and support.
The Ultimate Traders Starter Kit is available now, free with email. TradingView Mastery and the remaining courses are coming soon.
No. Every course is for educational purposes only and does not provide financial advice, trade recommendations, or guaranteed results.
Coming soon courses will unlock here on the site the moment each one is finalized — check back on the Education tab for the latest status.
Choose “Unlock free with email” on the Starter Kit card. After signup succeeds, the interactive Starter Kit opens right here on the site and remains available from the card for this visit.
No. The Starter Kit begins with the fundamentals and builds the core knowledge step by step.
Start with the Starter Kit first, then TradingView Mastery, then Smart Money Concepts, then Wyckoff. Each step assumes the skills of the last.
Build daily, weekly, monthly, and process goals with risk limits, setup standards, mindset intentions, and downloadable review plans.
Set a target once. This tool measures it against your live journal statistics automatically.
Your capital is your business — this section is how you protect it. Before you think about profits, you learn to size every trade correctly, set daily and weekly loss limits, and plan each trade before you place it, so one bad trade — or one bad day — can never blow your account. Run every trade through these tools first. This is the routine that keeps you in the game long enough to get good.
The Position Size Calculator below is the everyday tool — balance, risk %, and stop distance in, exact lot size out. Use it for most trades. Its partner, the Risk Analyzer in the Advanced tools further down, runs the same math with your broker’s exact rules — minimum sizes, size steps, and entry / stop / target prices — for when precision matters. The loss-limit guardrail and the pre-trade plan below complete the core routine; everything after them is a supporting tool for a specific job.
Use the point or pip value shown by your broker
Your stop belongs where your trade idea is proven wrong — beyond the structure. Never place it where the size “looks nice.” Structure decides the distance; this tool converts it into size. Formula: Position Size = Risk Amount ÷ (Stop Distance × Value Per Point).
Position size = risk amount ÷ (stop distance × value per point at one lot). Confirm the point value in your live broker platform before placing a trade.
Percent mode is the survival feature: as your account shrinks, dollar risk shrinks automatically.
Educational calculator only. Contract specifications and point values vary by instrument, broker, account currency, and contract type. Confirm the point value and final order size in your broker platform before placing a trade.
Set daily and weekly loss limits — get warned before you cross them.
No journal entries — unlogged trades are invisible to this guardrail.
Educational planning aid only — not financial advice. Limits are computed from journal entries in this session.
Your trade blueprint: entry, stop, target, size, and reason — before you enter.
This plan stays only while the page is open. Download it or send it to the session journal before refreshing. Educational planning tool only; verify every order detail with your broker.
The Risk Analyzer tab below is the second core calculator — the broker-exact partner to the Position Size Calculator above. The other tabs are supporting tools for specific jobs: prop-firm limits, pip values, account math, streak and budget planning, challenge tracking, and correlation caps, plus extra calculators and advanced planners. Open them when the job calls for them.
Risk Analyzer — core tool. The broker-exact partner to the Position Size Calculator at the top of this page. Use it when your broker enforces minimum order sizes or size steps, or when you want sizing worked out from exact entry, stop, and target prices. The quick calculator beside it mirrors the Position Size Calculator for a fast check without scrolling back up.
Quick position sizing
Everything from the Risk page, here beside your advanced workflow.
Your stop belongs where your trade idea is proven wrong — beyond the structure. Never place it where the size “looks nice.” Structure decides the distance; this tool converts it into size. Formula: Position Size = Risk Amount ÷ (Stop Distance × Value Per Point).
Position size = risk amount ÷ (stop distance × value per point at one lot). Confirm the point value in your live broker platform.
Percent mode is the survival feature: as your account shrinks, dollar risk shrinks automatically.
Advanced broker-specific sizing
Starter specifications are provided for planning. Confirm them with your broker.
Educational calculator only. Point values and contract sizes vary by broker and account. Verify every specification and the final order size before placing a trade.
See the true all-in cost of every prop firm trade.
A 1:2 setup can be ~1:1.6 after costs. Most evaluation failures come from costs eating the edge.
Published FTMO schedule estimate · live spreads vary · every field stays editable. Account size and balance are shared across the calculators.
all-in cost = spread cost + commission + slippage costnet R:R = (reward − costs) ÷ (planned risk + costs)FTMO figures are planning references, not live quotes. Verify current rules, spread, slippage, commission, and final order size before trading.
Starter estimates — confirm pip values in your live broker platform. Cross-pair values shift with live rates.
What one pip or point is worth in dollars, for your size.
Standard forex lot: 100,000 units.
Pips and points are units of price movement. Convert the price change into the correct unit, then multiply by its value at your lot size.
Most forex pairs use the fourth decimal; yen pairs use the second. Indices count whole index points. Gold is measured directly in dollars.
move in pips = |exit − entry| ÷ pip size
pip value = pip size × contract size × quote-to-account conversion × lot size
move value = move × value per pip or point
EUR/USD at 1 standard lot: 0.0001 × 100,000 = $10 per pip
1.0852 → 1.0872 is 20 pips. On 1 mini lot (0.10), 20 × $1 per pip = $20.
44,000 → 43,950 is 50 points. At $1 per point, 50 × $1 = $50.
2,900 → 2,915 is a $15.00 move. Multiply $15 by your broker's lot value.
Starter estimates: cross-pair pip values depend on the exchange rate used to convert the quote currency into your account currency (rates as of October 2026); confirm with your broker — planning references, not live quotes. Educational tool only; not financial advice.
Use these calculators to understand what your account must recover, what an estimated edge can withstand, how returns compound, and where fees or overtrading drain performance.
Measure the asymmetry of losses and model a fixed monthly-return scenario.
See the gain you actually need to climb back to breakeven.
| Drawdown | Gain to recover |
|---|---|
| 5% | 5.3% |
| 10% | 11.1% |
| 15% | 17.6% |
| 20% | 25% |
| 25% | 33.3% |
| 30% | 42.9% |
| 40% | 66.7% |
| 50% | 100% |
A 42.9% recovery could take months — that is the real cost.
Formula: recovery gain = drawdown ÷ (100 − drawdown).
Project steady monthly growth — a scenario, not a forecast.
Scenario, not a forecast. Real equity curves wiggle — the smooth curve overstates reality. Losing months, flat months, and drawdowns all bend this line in real trading.
Formula: projected balance = starting balance × (1 + monthly return)months, capped at 60 months.
Estimate long-run ruin risk and calculate a Kelly ceiling from your own trading statistics.
Your odds of blowing up if you keep trading exactly like this.
Verdict: Ruin above 1% means your risk is too high.
Assumptions: independent trades, fixed statistics, and one average loss equal to the entered risk per trade. This estimate is not a guarantee.
The formula’s “optimal” risk size — and why pros trade far below it.
Full Kelly is aggressive and can create severe volatility and drawdowns. Treat it as a theoretical ceiling; many traders use a smaller fraction or fixed-fractional risk.
If Kelly says 25%, you still trade 1-2% — here's why: Kelly assumes known probabilities; yours are estimates.
Formula: Kelly = win probability − (loss probability ÷ payoff ratio). A non-positive result means the entered statistics do not support a Kelly allocation.
Translate repeated execution costs and avoidable extra trades into monthly and annual dollars.
Total your trading costs — see what they quietly do to profits.
If costs exceed ~20% of gross profit, you have a cost problem, not a strategy problem.
Use your broker statement's all-in average per completed trade, including commissions and other transaction charges you want to measure.
Price the trades you take from boredom, FOMO, or revenge.
This isolates avoidable losing trades. It does not assume every extra trade loses; use your own observed average if you have one.
Educational calculations based only on the values you enter — not financial advice, a performance promise, or a substitute for broker statements and verified trading records.
See the losing streaks hiding inside your win rate — before they hit.
Over a 1,000-trade career, you will almost certainly see this streak. Streaks are when, not if — size so you survive them.
equity after N losses = balance × (1 − risk%)^Nstreak odds = (1 − win rate)^NEducational math on the numbers you enter — not a prediction of results, not financial advice.
Split today’s maximum loss across the trades you plan to take.
Educational math on the numbers you enter — not financial advice.
Track progress against your firm’s rules. Peak: highest closing balance logged.
Find this on your firm's dashboard — always use their current numbers.
Clear every day-close entry and reset this tracker?
Educational math on the numbers you enter — not financial advice. Prop firm rules differ and may change; verify them on your firm's dashboard.
See when separate trades stack into one big correlated bet.
Educational planning aid only — not financial advice. Groupings are starter estimates of how these instruments often move; real relationships change with market conditions. Confirm every position and its risk in your broker platform before trading.
Six single-job calculators: slide your size, stress-test a plan, check margin and overnight costs, and mark Fibonacci and pivot levels.
Drag your risk percentage and watch your position size update instantly.
Run hundreds of possible futures for your plan and see the range of outcomes.
A scenario simulation, not a forecast. Assumptions do not predict future results.
How much of your account a trade ties up — before you place it.
Margin level uses your balance as the equity proxy.
The true cost of holding a trade overnight — per night and in total.
Swap rates are broker-specific — enter the rates from your broker's instrument specification.
Retracement and extension levels for any swing, calculated instantly.
| Level | Price |
|---|
The previous period's key levels, calculated three ways.
| Level | Price |
|---|
Plan exits in stages, price the worst case, map a recovery, see your edge in R, and view total portfolio heat in one place.
Your edge in R — paste past trades and see the distribution.
Bank part of a winner early — and see exactly what it does to the rest.
Verdict: Covered — locked profit covers the remaining risk, so the stop can move to entry and the trade cannot lose.
Leave in stages — see what each exit is worth before the trade.
Stage percentages add to 100% — they must add to 100% for a complete exit plan.
Size remaining after each stage: 0.75 · 0.50 · 0.00 lots. Weighted average exit equals 2.25R.
What a losing streak actually does to your account — before it happens.
Same streak at 2% risk: $8,170.73 left, 18.29% drawdown, 22.39% to recover.
Turn “make it back” into a number of trades or months.
Everything you have at risk right now, grouped by what it is correlated to.
Live gauge of daily loss vs.
Pre-breach alerts before emotions decide for you When All session — check after every trade Note: Set your daily stop before the session, when you're calm.
All session — check after every trade Note: Set your daily stop before the session, when you're calm.
You get a clear, repeatable process instead of relying on memory or emotion.
Your daily stop, visualized. Set it before the session — respect it during.
Educational content only, not financial advice.
An interactive drawdown recovery: how much to recover? tool for your trading routine.
It guides you step by step so nothing gets missed.
Open it when you need it and follow the steps.
You get a clear, repeatable process instead of relying on memory or emotion.
Shows exactly how much gain you need to climb out of a drawdown — and how long it takes at a steady monthly return.
Losses need bigger wins to recover than most traders expect. Seeing the real number kills the urge to force it back fast.
Use after a losing stretch or in your weekend review. Never mid-tilt — step away first, run the numbers when calm.
| Drawdown | Gain to recover |
|---|
The math punishes revenge sizing — a calm plan recovers faster than a desperate one.
Educational content only, not financial advice.
Educational content only, not financial advice.
Checks whether your open positions stack into one big directional bet.
Two or three "different" positions often move as one trade.
Use this before adding any second position — and any time you hold more than one trade.
You get a clear, repeatable process instead of relying on memory or emotion.
Flags stacked, correlated risk before one macro move hits everything at once.
Checks whether your open positions stack into one big directional bet.
Two or three "different" positions often move as one trade. That is one macro move hitting your whole account at the same time.
Use this before adding any second position — and any time you hold more than one trade.
Add your first position to see your effective exposure.
$0.00
Practitioner rules of thumb, not precise statistics. Correlations shift over time and can break down fast in stressed markets — treat these as a caution flag, not a measurement.
Educational content only, not financial advice.
An interactive evaluation tracker: where do i stand? tool for your trading routine.
It guides you step by step so nothing gets missed.
Open it when you need it and follow the steps.
You get a clear, repeatable process instead of relying on memory or emotion.
Your live challenge dashboard — one glance tells you where you stand.
—
Enter your numbers and tap Update numbers.
Note: Rules differ per firm — always check your firm's current terms. This tracker uses your start balance as the drawdown reference; some firms trail from your peak balance, so verify how your firm measures it.
All times Eastern Time (ET).
Educational content only, not financial advice.
Educational content only, not financial advice.
An interactive consistency tracker: build habits that stick tool for your trading routine.
strong{color:var(--gold);} .
Open it when you need it and follow the steps.
You get a clear, repeatable process instead of relying on memory or emotion.
Build the habit, keep the streak — even when life happens. One freeze token per week protects your streak from a missed day.
Missed a day without a freeze? The streak resets — gently. The habit matters more than the number.
The habit matters more than the number. Yesterday is done — today is a fresh day one, and day one counts.
Educational content only, not financial advice.
Prototype — saving progress across visits arrives with site accounts later. Times shown in ET.
Educational content only, not financial advice.
Trading is 5% skill and 95% mental. Trading psychology is the most important part.
Everything in the Mindset Zone, laid out in order: start with the audio program, practise with the tools, work through the workbook, and keep growing with the personal development resources. Tap any card to jump straight to that section.
The Mindset Zone Audio Program — 10 essential tracks, 20 recordings in two voices — plus the additional audios, all together in one place.
Go to Audios → Practise · Apply the lessonsEvery mindset tool in one section — the companion tools, the Revenge Circuit Breaker, the Stage Tracker, and the Rich Rising morning routine.
Go to Tools → Read & write · The paired companionThe Mindset Zone Workbook — a fillable workbook plus the cheat sheet, paired lesson-by-lesson with the audio program. Yours to keep.
Go to Workbooks → Grow · The person behind the planTrader-focused practices and resources for strengthening the person behind the plan — routines, attention, and self-awareness that support disciplined execution.
Go to Personal Development Resources →Three steps. Each one builds on the last.
Follow your rules precisely. Structure is your edge.
Judgment inside structure. Discretion, honestly applied.
Pattern recognition as second nature. Calm execution.
The truths dissolve fear. The principles build consistency. The stages show you how far you've come.
Educational content only, not financial advice.
10 essential mindset tracks, each recorded in both brand voices. Choose your guide, then play a free 45-second preview of any track. One email unlocks every full recording and the complete Mindset Zone.
A psychology framework for building consistency, discipline, and confidence in every trading session.
Short motivational pieces for grand rising and beyond, offered as a companion shelf beneath the core Trading in the Zone program.
Use these exercises with the Trading in the Zone audio program and workbook: listen first, complete the matching workbook lesson, then use the tool to practice the idea in your trading.
A 21-day interactive program: complete one short lesson a day, then record the matching daily practice and check-in.
Locked 02 · START HEREMeasure how your current thinking aligns with consistent, probability-based execution.
Locked 03 · INTERACTIVE DIAGNOSTICAnswer honestly and get your fear profile on the spot — which of the four fears runs your trading, and how strongly.
Locked 04 · GUIDED PRACTICEUse guided sessions to examine and replace the beliefs that interfere with execution.
Locked 05 · DAILY REFERENCEKeep the seven principles visible with a print-ready desk card and phone wallpaper.
Locked 06 · TRADER DEVELOPMENTDiscover which stage of trader development you're in — Mechanical, Subjective, or Intuitive — and get specific practices to level up.
When to use it: Take this when you're new to the site, then retake every 3 months. Your stage will change as you develop — and the practices you need change with it. A Mechanical-stage trader needs different work than an Intuitive-stage trader. Knowing where you are prevents you from doing advanced work before you've mastered the basics (or boring basics when you're ready for more).
Read the five fundamental truths and seven principles of consistency aloud before you trade. Tick each one as you say it, then download your completed sheet.
FREE · Open tool →Read each reminder aloud, then tick its card. Tick all twelve to complete today's ritual — the five fundamental truths and the seven principles of consistency.
An interactive daily ritual: the five fundamental truths and seven principles of consistency from the Mindset Zone, rebuilt as tick-off cards you complete before every trading session.
It turns the daily reminders into a physical routine — you read each one aloud and tick it, which moves the ideas out of the page and into your working memory before you risk money.
Open this tool before every trading session. Read each reminder aloud, then tap its card to tick it. When all twelve are ticked, download or print your completed sheet.
A consistent pre-session ritual that anchors the right beliefs before the market can test them — the same truths and principles, reinforced daily instead of read once and forgotten.
The Zone — say them daily.
The beliefs of every consistently successful trader.
Educational content only, not financial advice.
For the moment right after a loss, when the only trade you want is the one that wins it back. Pull the breaker and follow the protocol — pause, assess, cool down, re-anchor — before any next trade.
That urge is the most expensive feeling in trading. Pull the breaker now, before the next click. The protocol takes a few minutes; a revenge spiral takes the account.
Move your hands away from the mouse and keyboard. Nothing gets clicked while this timer runs. Breathe out slowly and let the first wave pass.
How strong is the urge to win it back right now?
What just happened?
Have you already increased your size — or are you about to?
Pick your cooldown. The timer is the rule — the next step unlocks only when it finishes.
Confirm each statement — out loud counts. Then rate the urge one more time.
How strong is the urge now?
See whether you are developing in the Mechanical, Subjective, or Intuitive stage, then get specific practices to guide what you work on next.
Your morning routine and pre-trade checklist for entering each session clear, intentional, and ready.
Build a grounded morning rhythm, speak life over your trading day, and complete the Rich Rising pre-trade checklist.
Work the routine in order, then set the intention you will trade under. Download your morning sheet when you're done.
After each core audio lesson, complete its matching workbook practice. Then use the companion tools to apply the lesson. The whole workbook runs interactively right here — fill it in on this page, then download a copy of your own answers.
The new fillable edition includes auto-scoring, a signable risk-acceptance contract, the four fears worksheet, pre-market ritual checklist, 21-day completion certificate, and zone journal—alongside the five truths, seven principles, probability drills, beliefs inventory, and 21-day scorecard.
Work through each part in order. Everything you write stays in this tab for the session — download a copy of your workbook when you finish.
Read each truth, then write what it means for your trading — in your own words.
Commit to each principle. These are the same seven principles as your Trader's Creed card.
Accept each statement, then sign. This is the agreement you trade under.
Not signed yet.
Rate how strongly each fear shows up in your trading (1 = rarely, 5 = it runs the show), then write the reframe you will use.
Answer honestly. Your score updates as you go.
An edge only proves itself across a series. Mark a sample of 20 trades W or L and watch the distribution — any single outcome means nothing; the series is the point.
Run this before every session.
One day at a time. Mark each day you complete the lesson and its practice.
All seven principles committed, the risk-acceptance contract signed, and 21 days on the scorecard. Keep going — consistency is the whole game.
The whole framework on one screen — the truths, the principles, the fears, and the ritual.
Trader-focused practices and resources for strengthening the person behind the plan—so your routines, attention, self-awareness, and daily decisions support disciplined execution.
This subsection will bring gratitude practice, planning tools, and mental-performance resources into one organized home, with every resource connected directly to trading.
New journals, calendars, guided practices, and tools will be added here as the Mindset Zone grows.
Ask where to find a feature or how a site tool works. Answers are short and based on this website.
See the six core areas and where each part of your trading process lives.